Cato Analytics
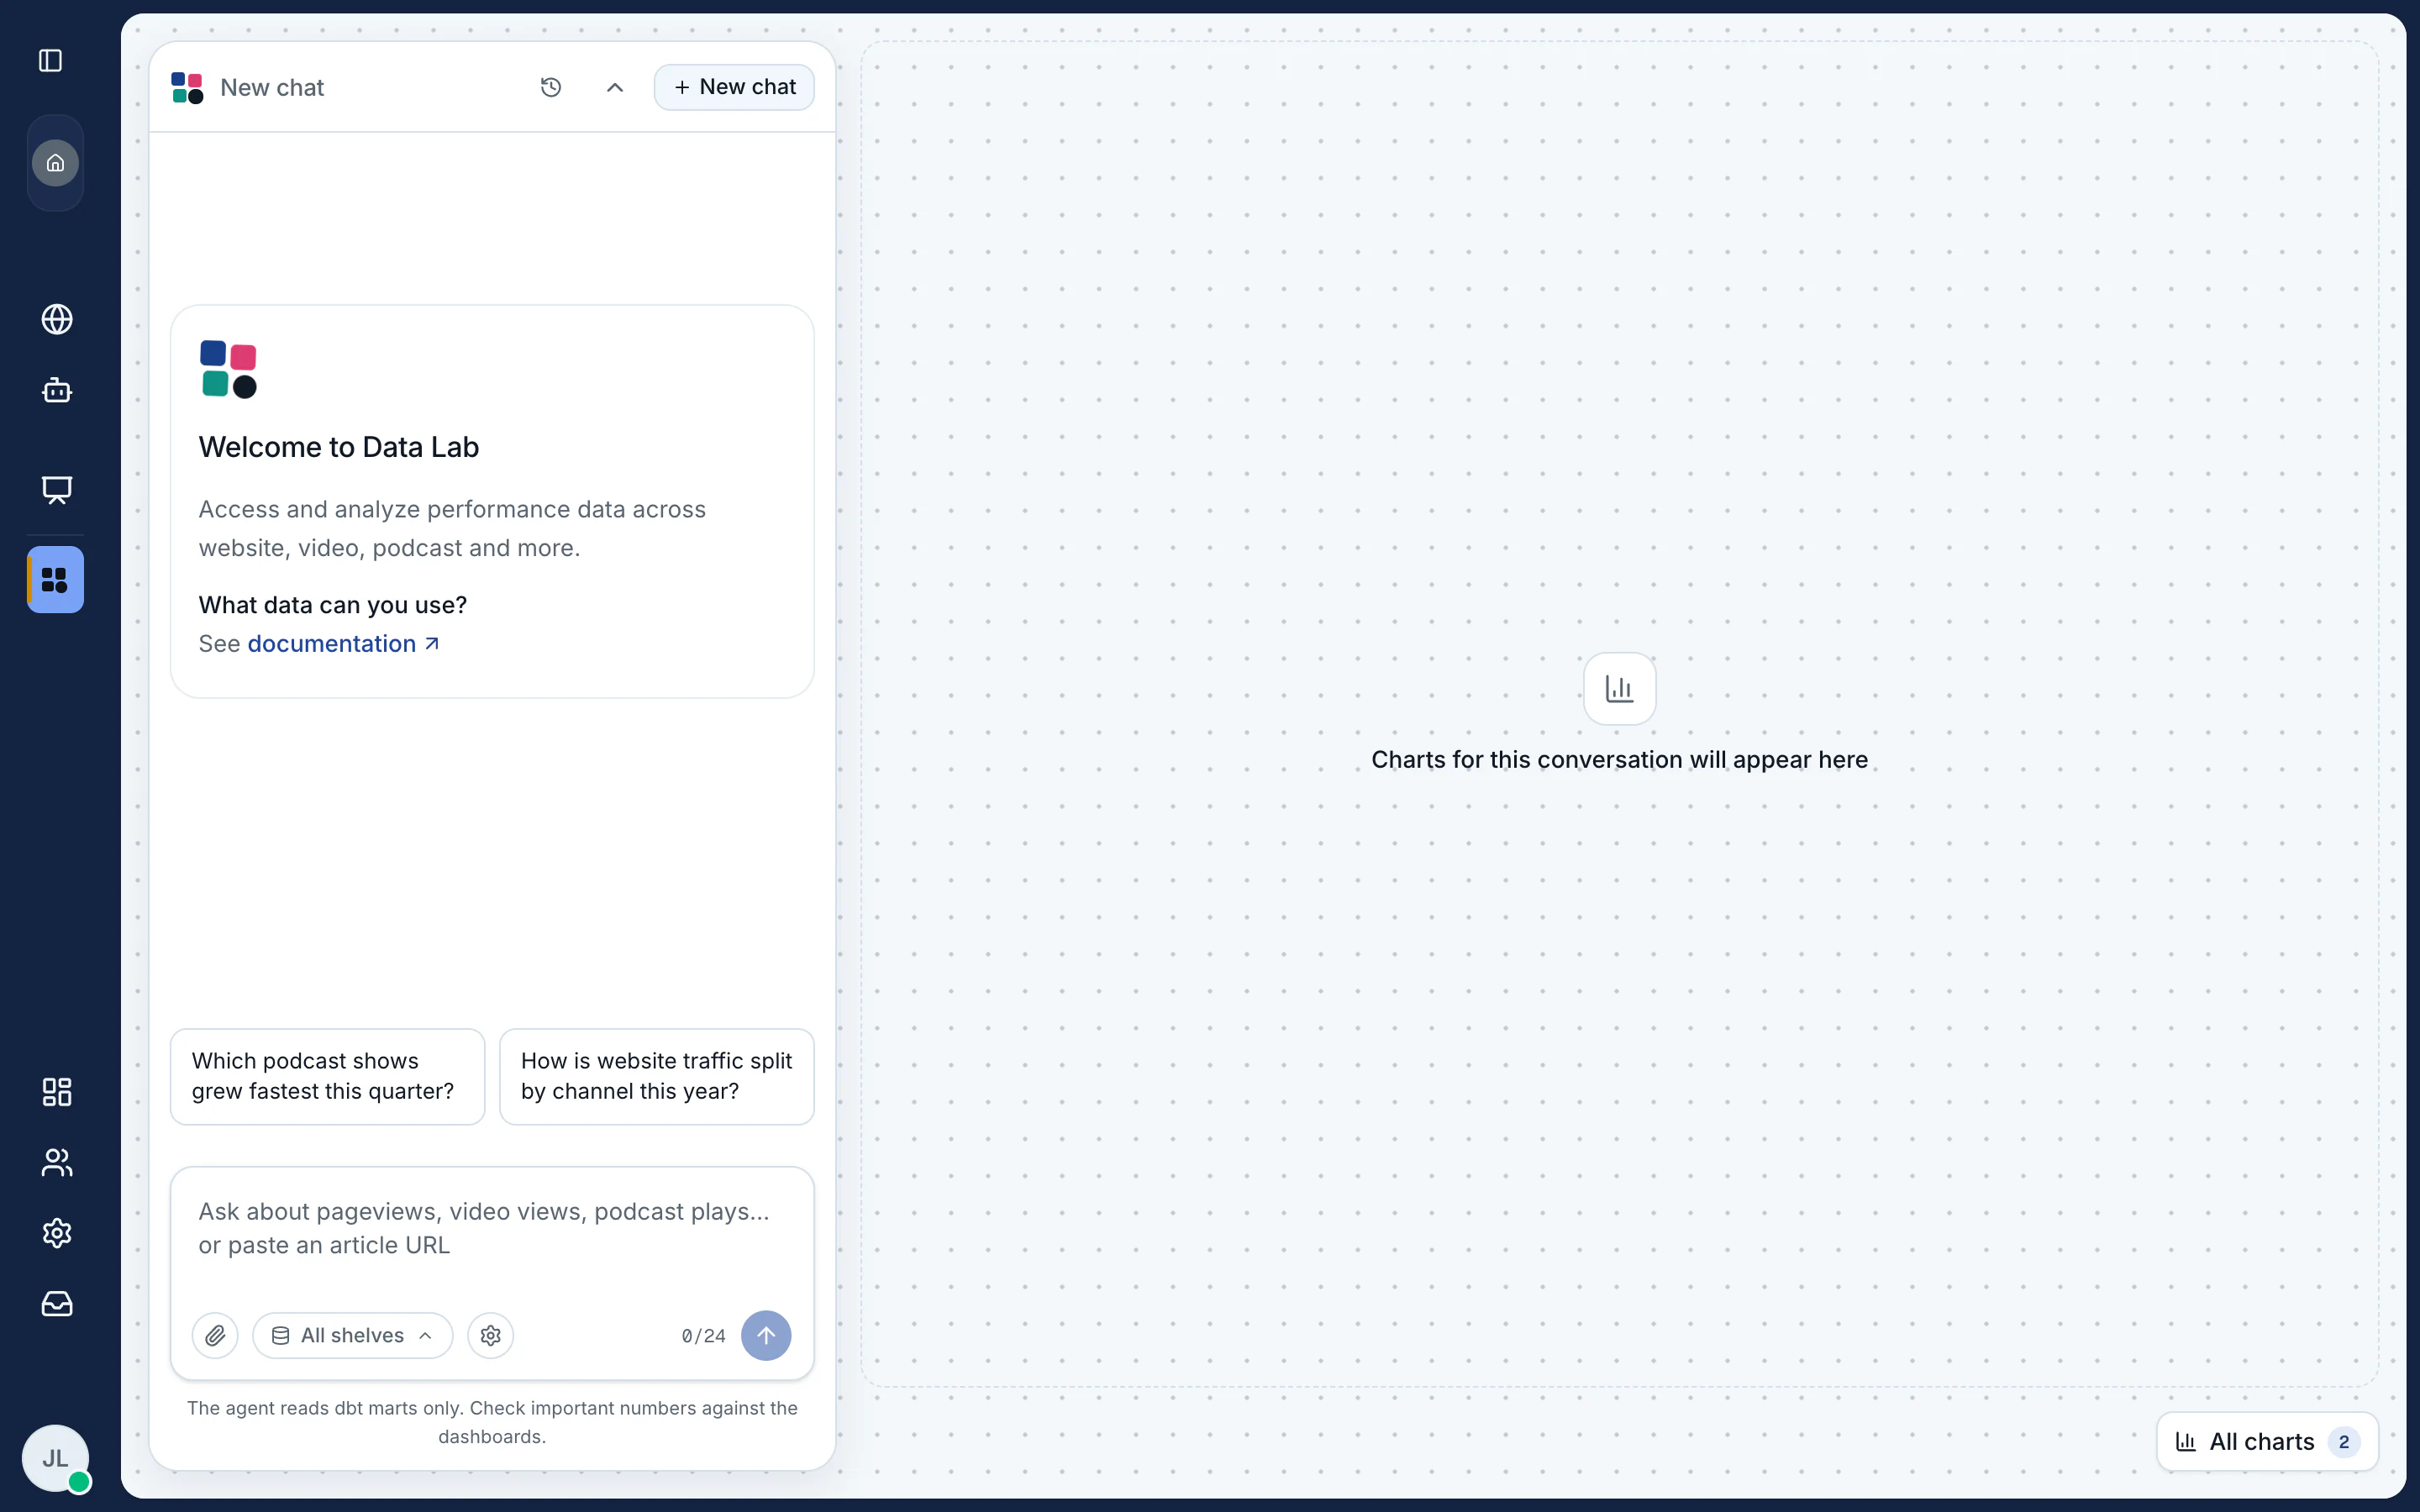
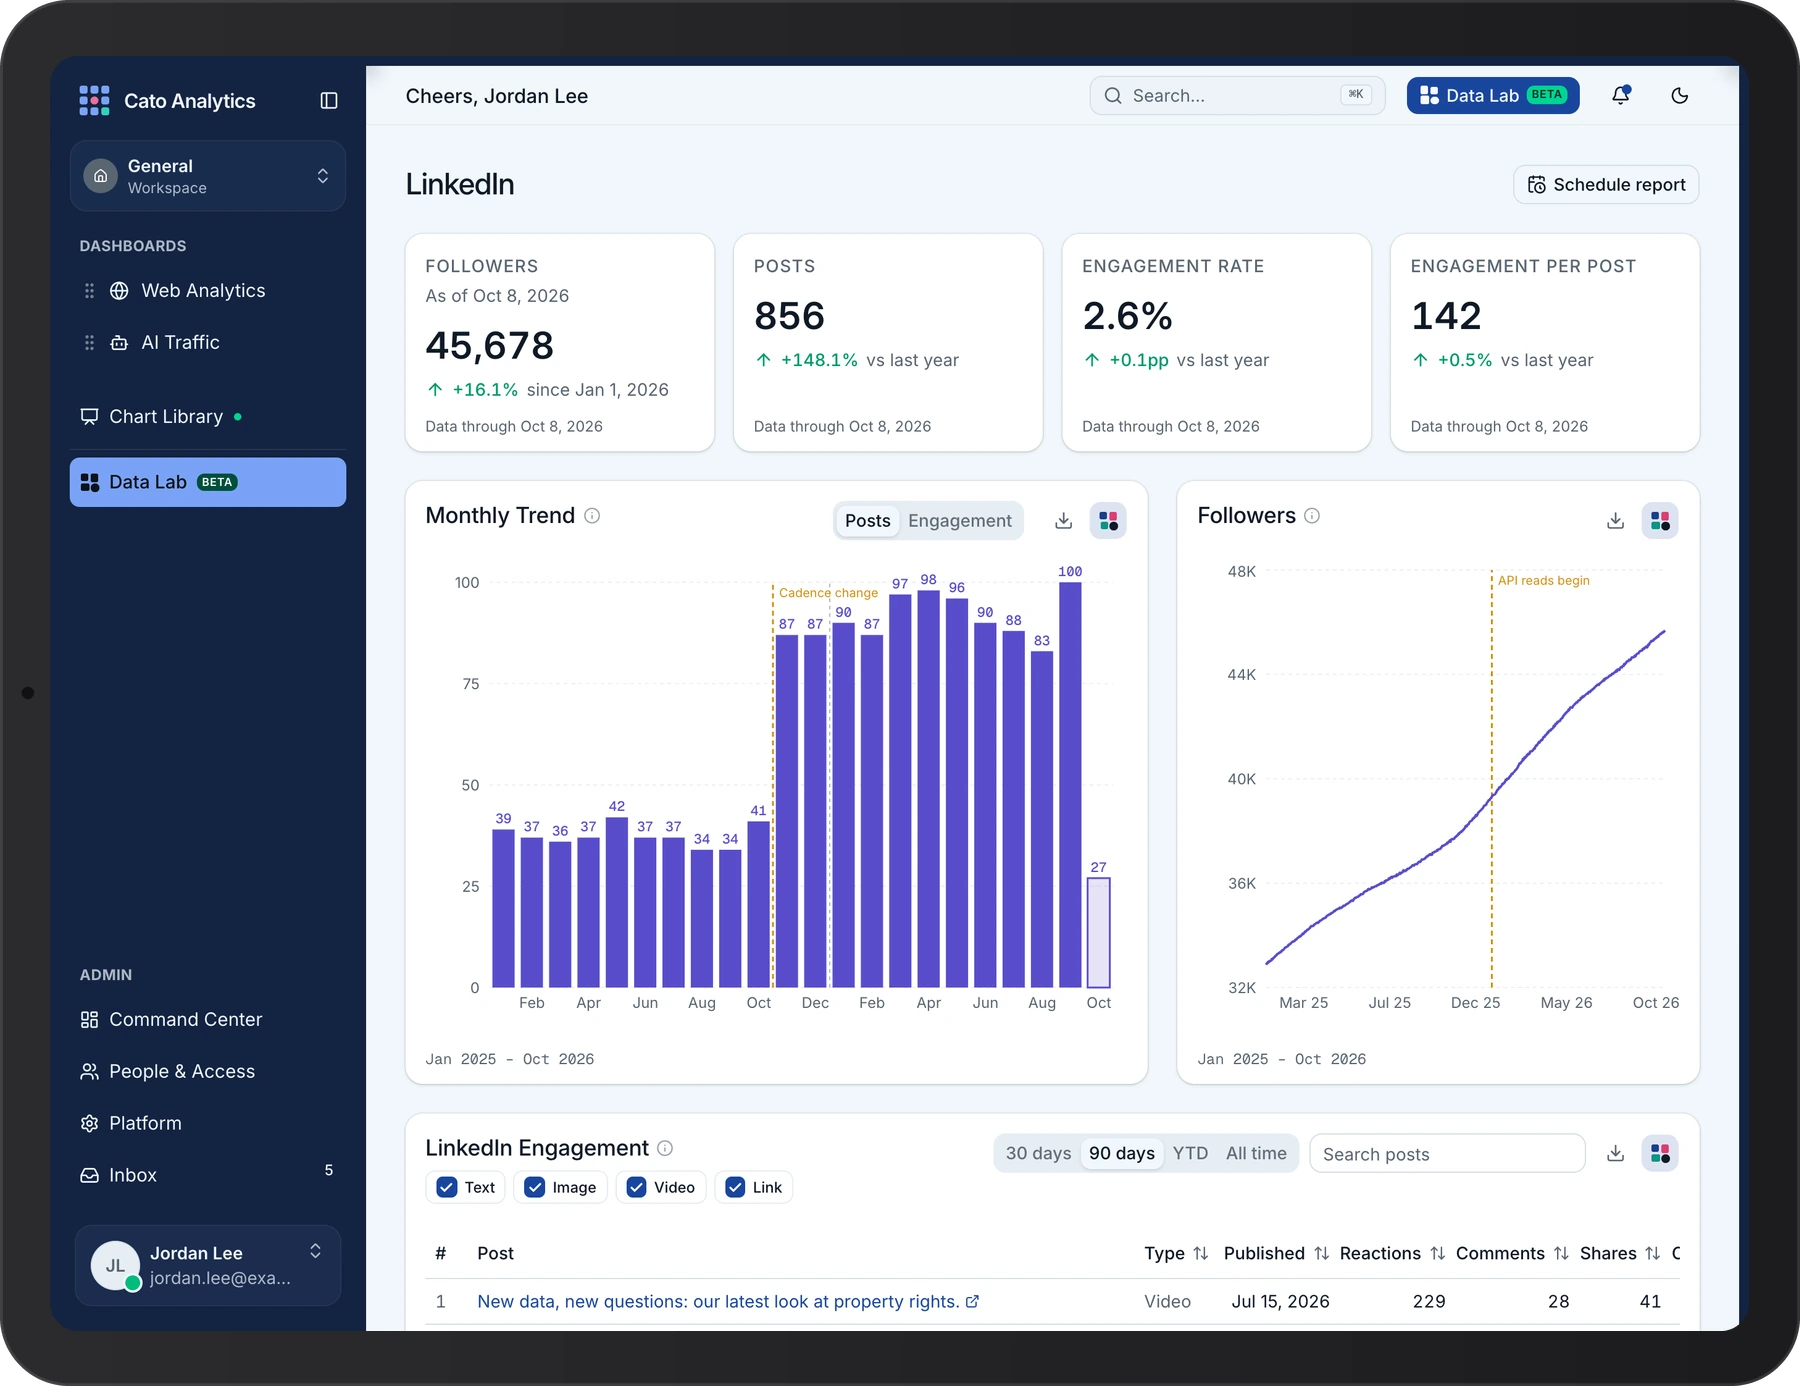
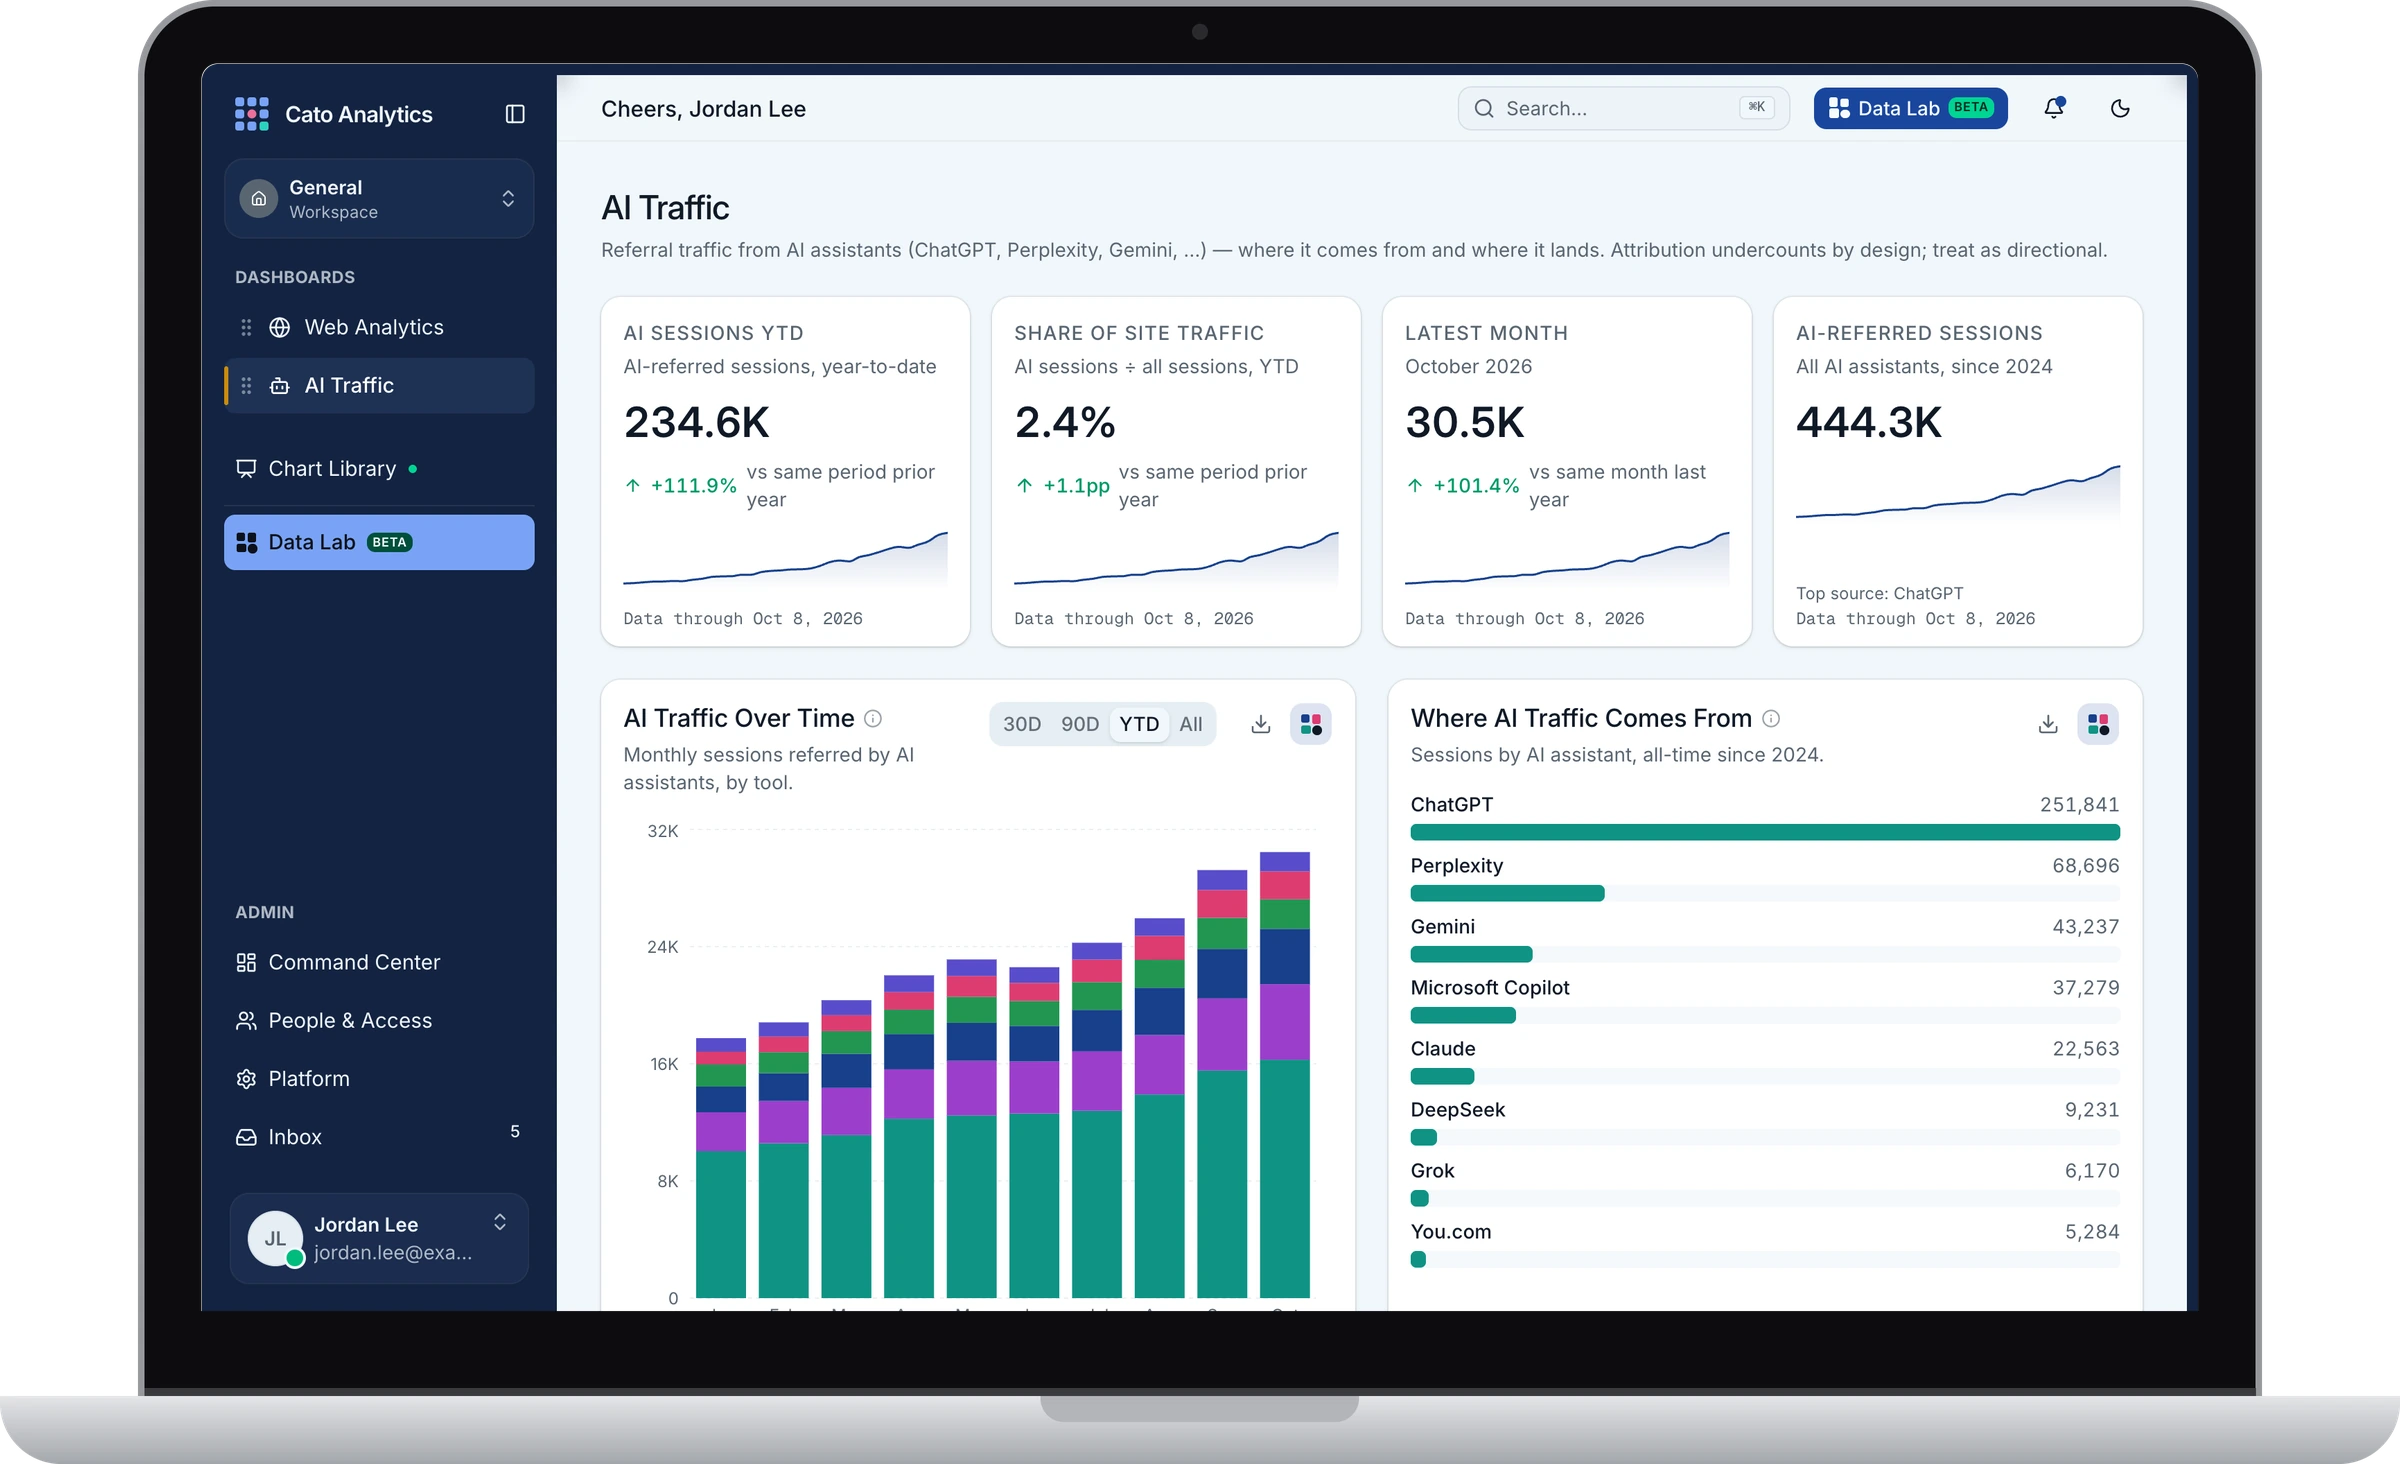
Cato Analytics is a data dashboard application designed from the ground up to provide a single source of truth for all data needs and reporting across the organization.
The design of this dashboard ensures all data reports can be reliably traced across different teams and needs, and allows our teams to cut costs on subscriptions.
Internal product · the real interface with invented data
Tools used for this project
- Figma
- Claude Code
- BigQuery
- Python
- Supabase
- Vercel










Approach
To kick off this project, I began documenting the most common data requests over the past year. This approach provided a reliable bird's-eye view of the key stakeholders, their primary goals and their frequency of use, and helped to define acceptance criteria for what an ideal solution should look and work like.
Planning & Exploration
Download process book (PDF, opens in a new tab)In planning phase 2, I studied the elements of good data visualizations, defined the design goals and features, and established the acceptance criteria that needed to inform the product design direction and, consequently, the development approach. The four primary values, or must-have criteria, were security, reliability, accessibility, and approachability.
Brand exploration
We built the Cato Analytics brand on the Cato blue and carried it into the dashboard. The logo, the loading animation, the color tokens and the chart palette are all extensions of the Cato blue palette, as we intended to approach the design with minimalism.
Approachable.
A clean and minimalist approach to the design encourages approachability, while onboarding features support learnability and quick mastery for first-time users, ensuring they spend more time exploring their data rather than learning how the system works.
Reliable.
Reliability comes from users' ability to trust the source of the data and its accuracy; hence, the data validity design seamlessly indicates the data freshness on all charts. This is also applied to the pipeline health indicator, with color codes to provide visual cues to users.
Signal over noise.
Because we worked closely with each team, the design of the system dashboard allows us to define and focus on the relevant metrics for each team, rather than displaying all possible metrics and numbers that may not communicate value to the teams that need them. This approach also allows for the slow introduction of new features that add value to the entire app and workflows, as needed by the teams.
Exploration & facilitating automations.
How do we deliver key reports to stakeholders who rarely open the dashboard? How do we build collaboration features within the dashboard to facilitate reporting? Scheduled reports send the headline numbers by e-mail, with a link back to the dashboard. A comment thread under each chart lets a team discuss it in place, without a meeting.
Safety, security and access privileges.
How does an admin give the right people the right data? How much friction should a risky change carry? An admin invites people by e-mail and sets each person's role, and a risky change, such as archiving a workspace, stops at a warning first.
Recovery.
How does a broken chart get fixed without a long e-mail thread? How do we tell “no data” apart from “something broke”? How do we facilitate user feedback on the system performance and app health? When a chart fails, the reader reports it from the account menu, and the report carries the page and browser details. The admin marks it fixed and sends the reader a note.
Accessibility & responsive design testing
How does one palette work in light and dark? Does the system hold up on every screen?
Reflection
This project was particularly exciting for me because it is at the perfect point of merger for someone with a background in both design and data engineering. It also served as the planting ground for my exploration of AI-assisted development. Leaning heavily on Claude Code for the development, as the models got better, allowed me to focus on stress-testing the underlying data pipelines for this project and on crafting an exceptional user experience. I was also excited by the quick adoption across the company, an achievement I believe was possible mostly because the stakeholders were at the forefront, informing the design decisions and sharing feedback each step of the way.
Questions about this project?
Get in touch