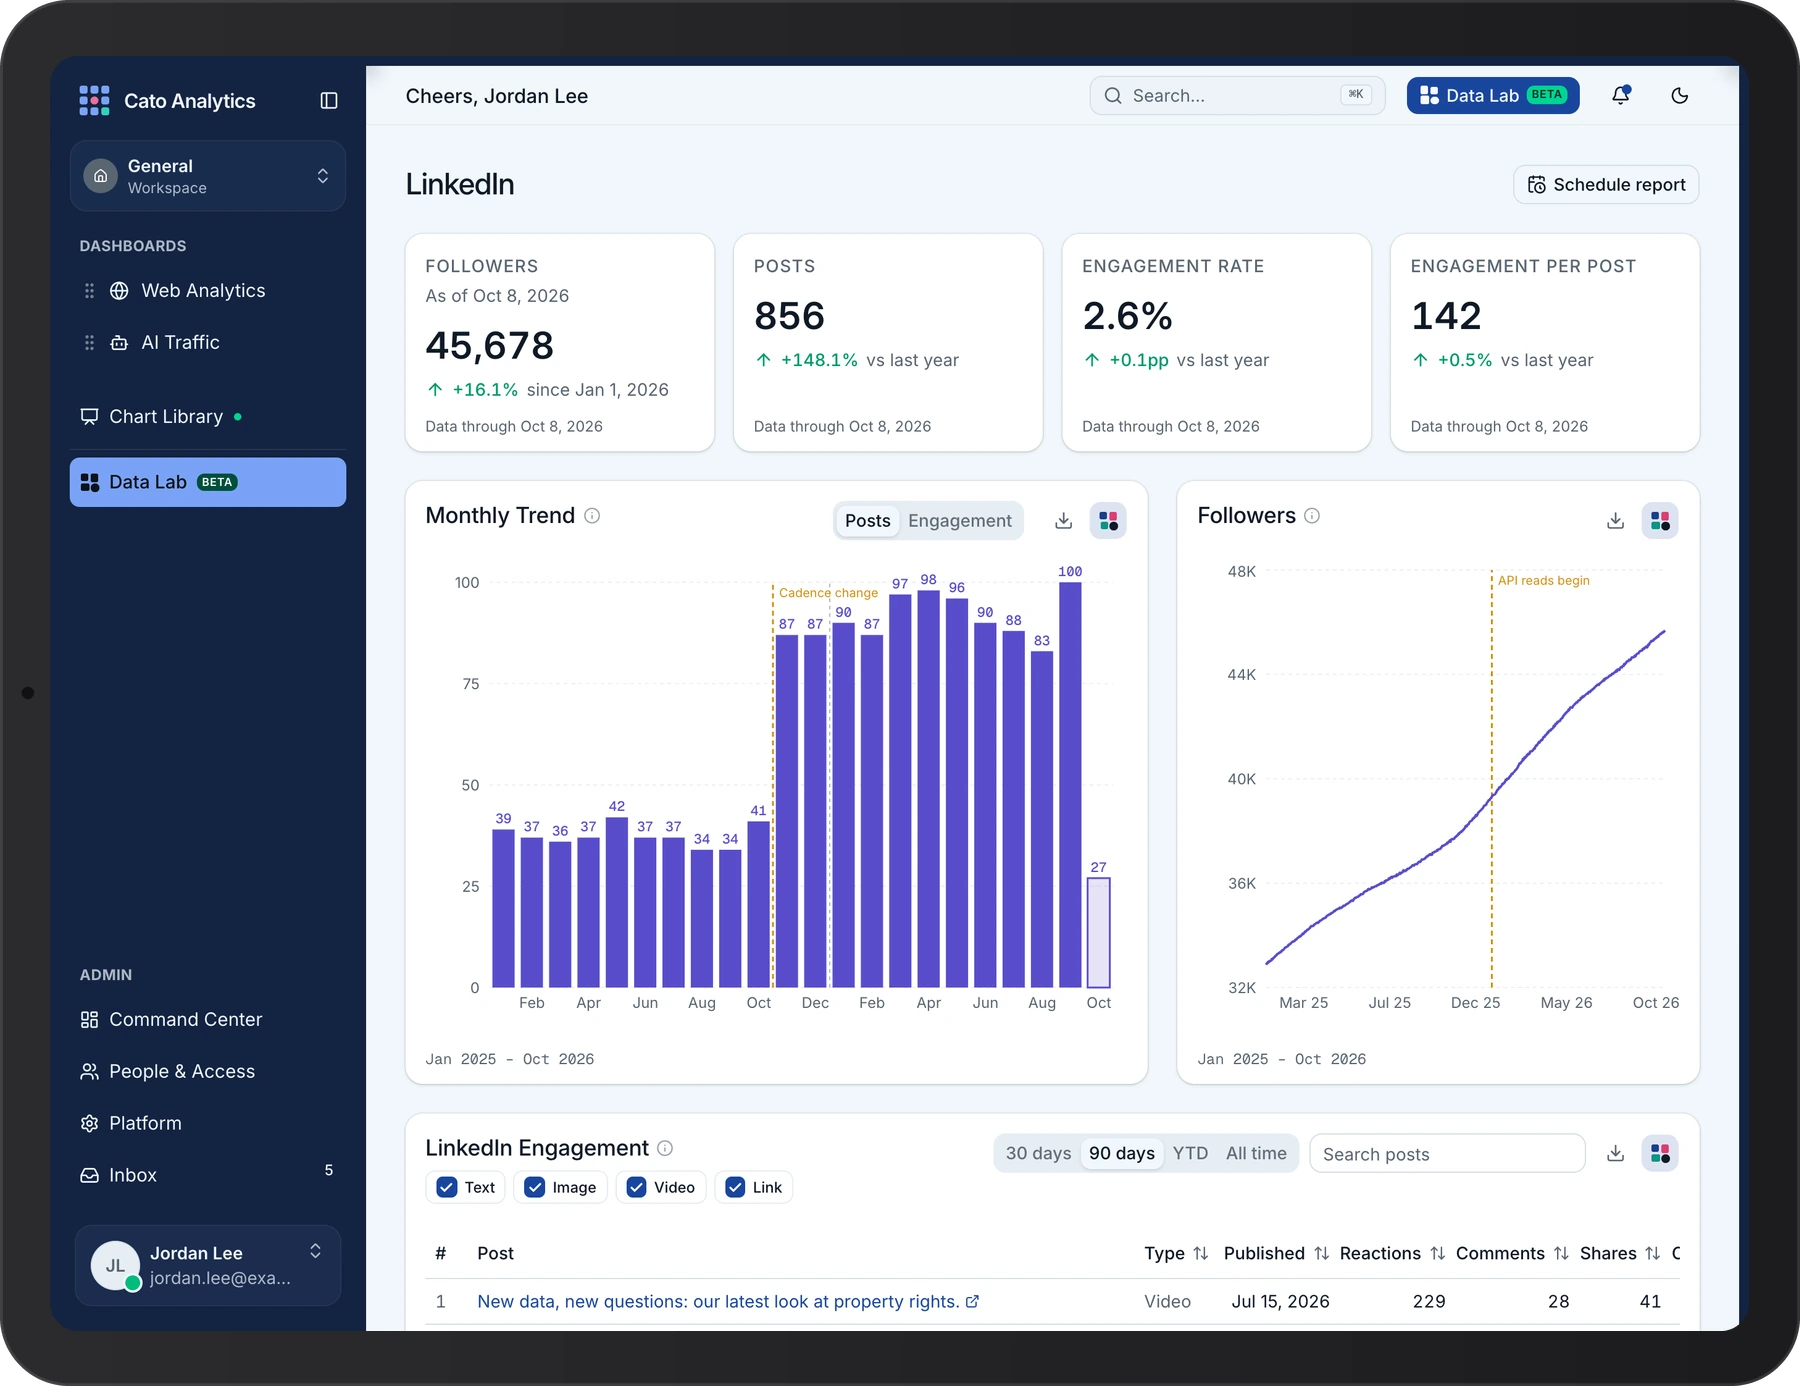
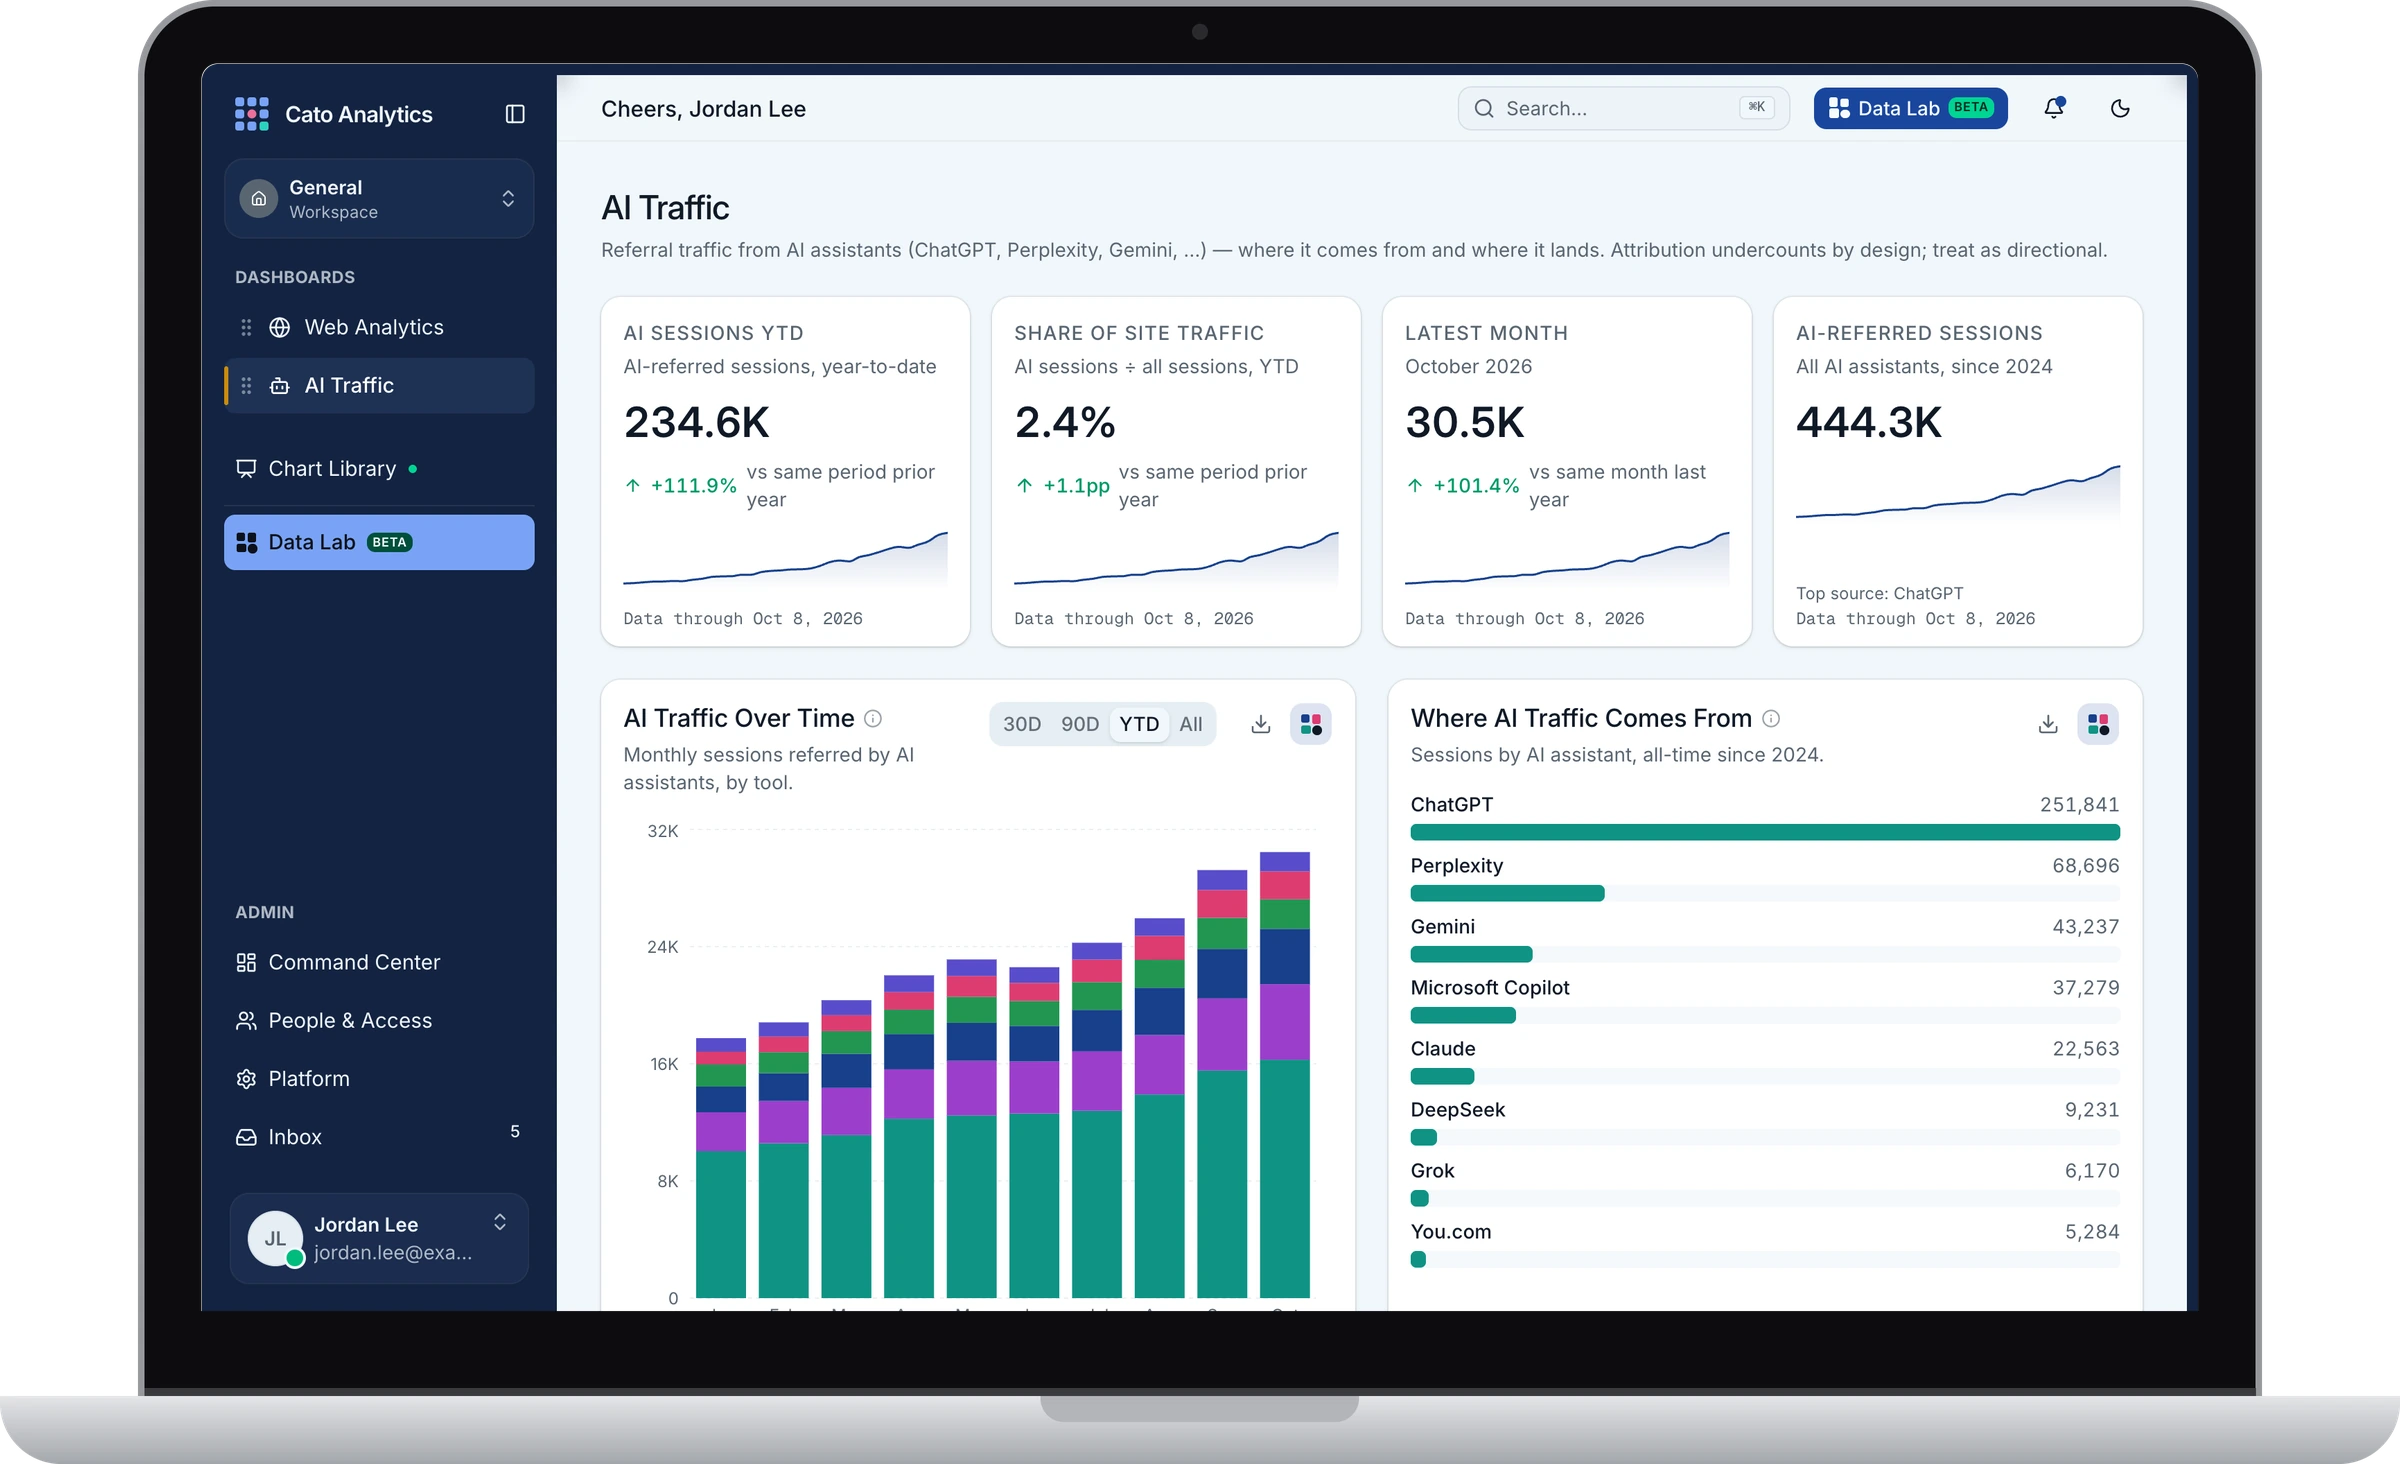
Data Lab
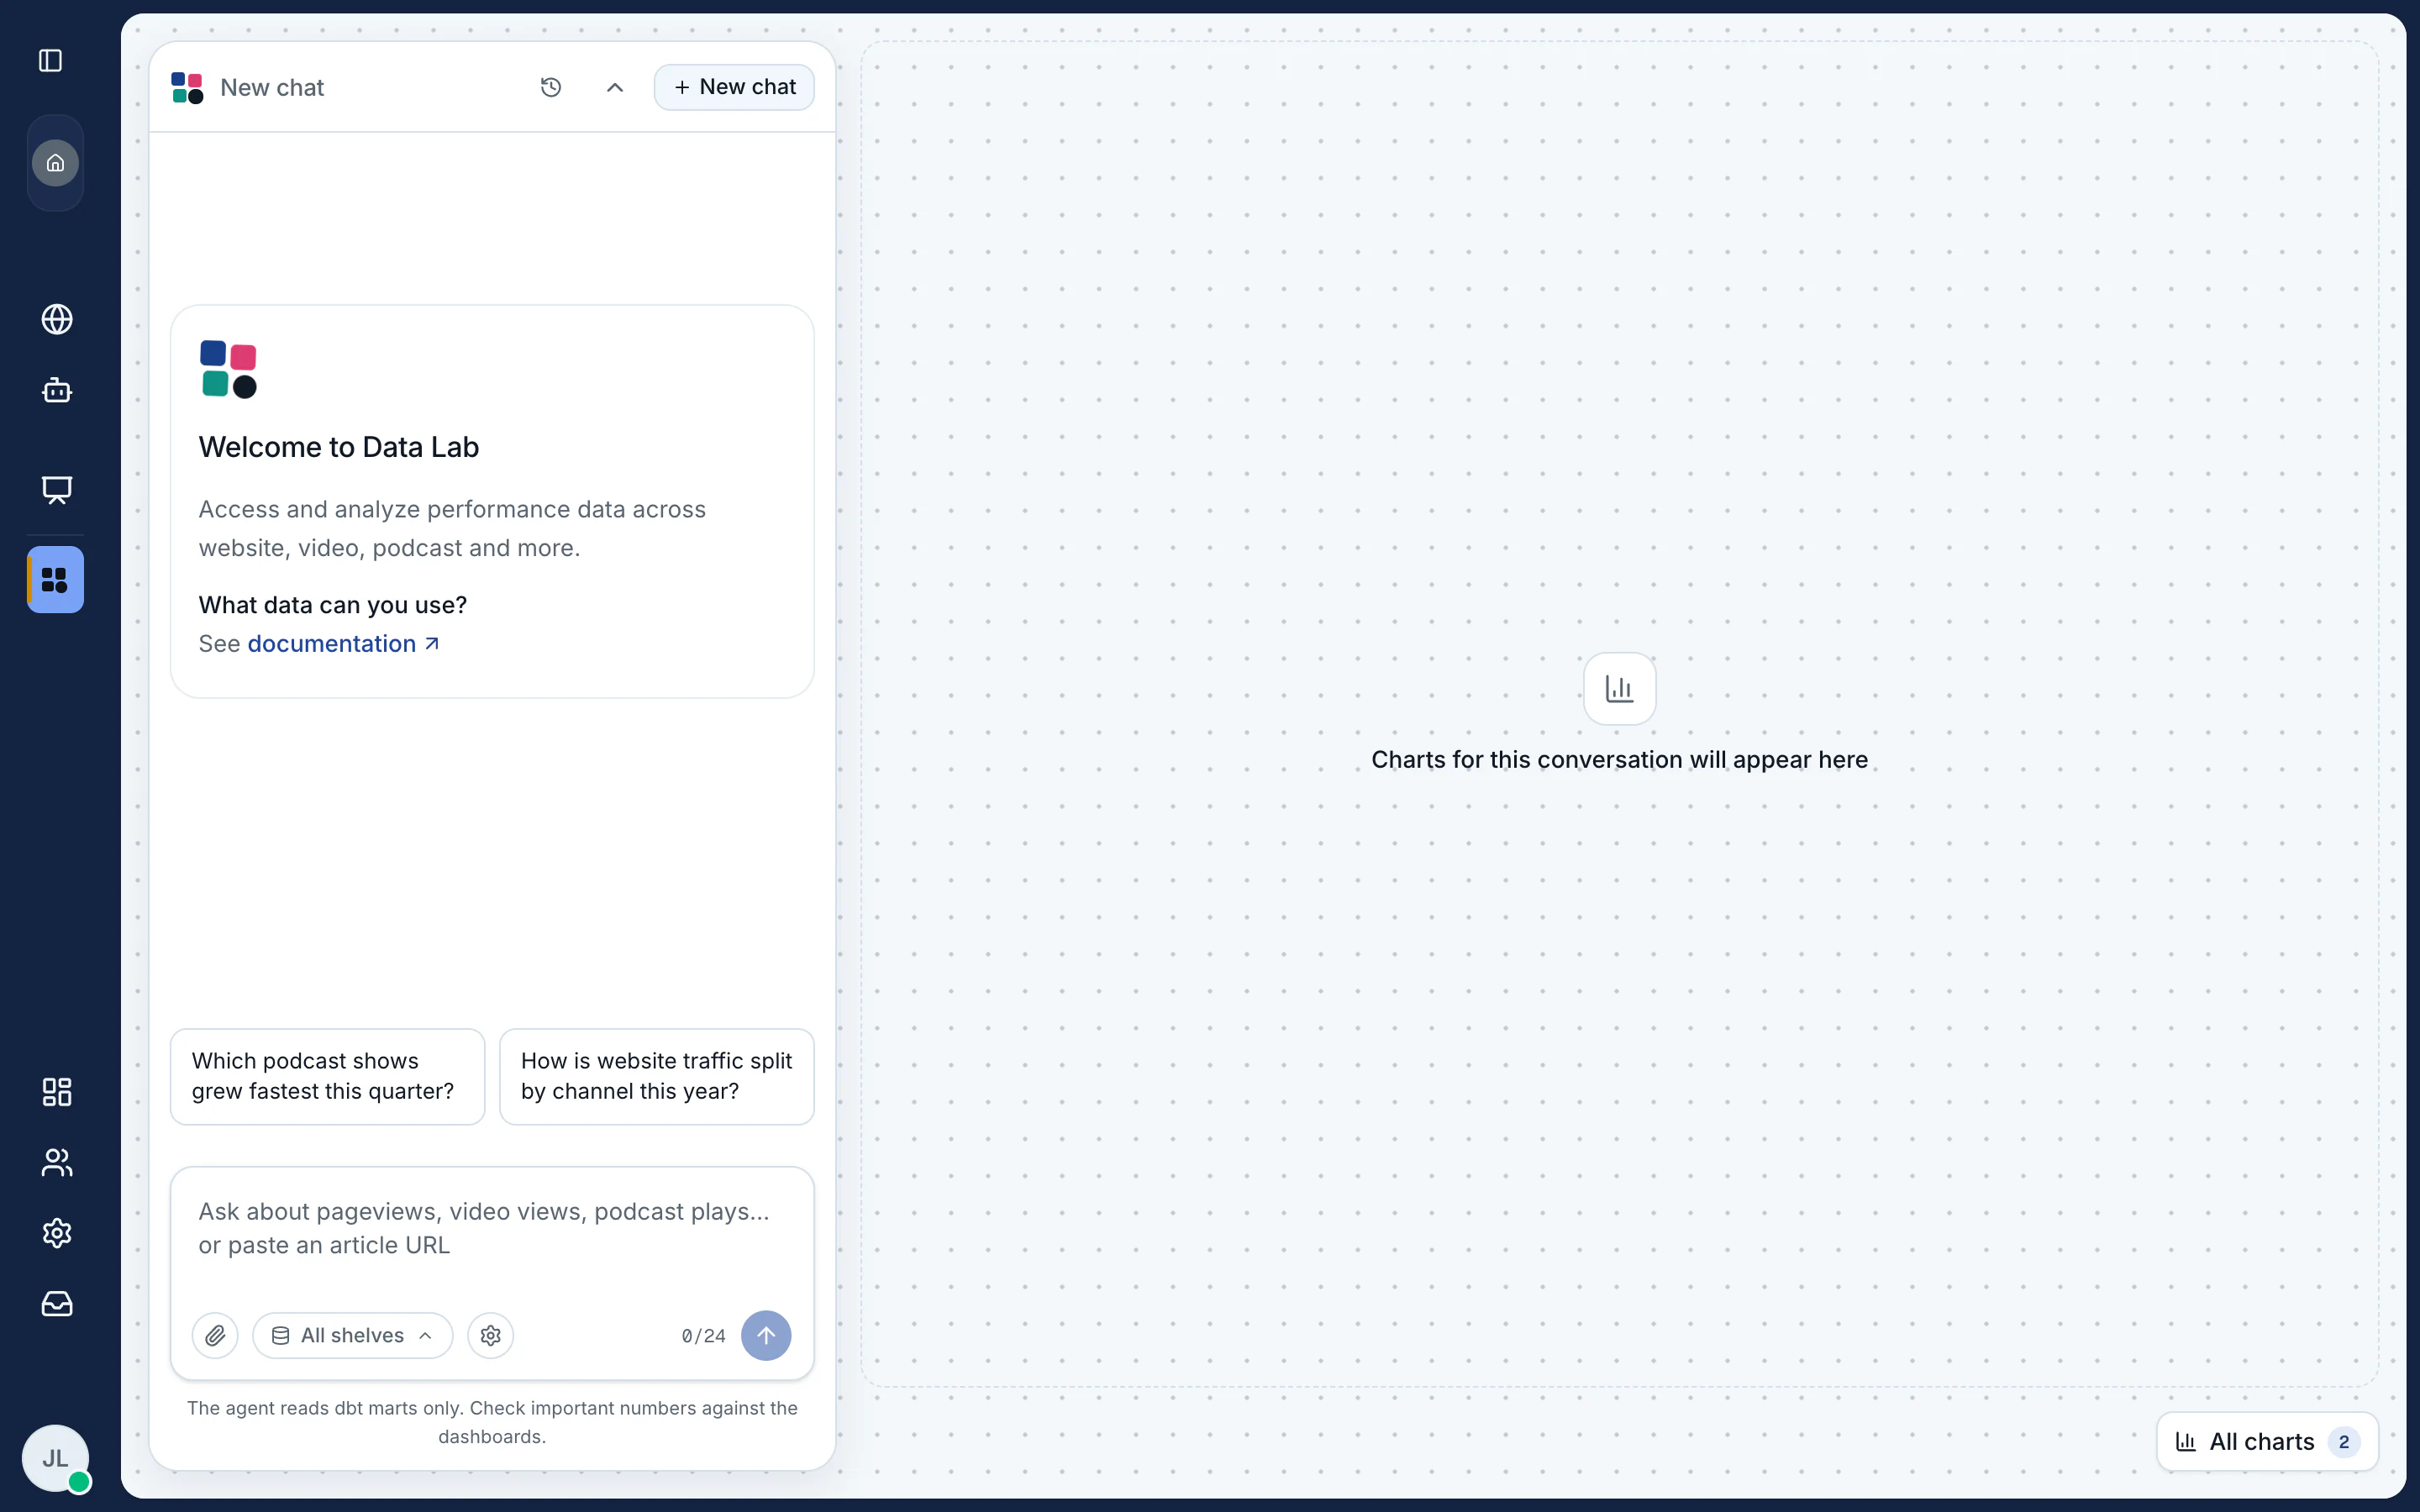
Dashboards bring clarity and excitement, but also follow-up questions that wait on an analyst for another chart. Generic AI chatbots return unreliable numbers without the right data setup for every user. So I designed and shipped Data Lab, a self-serve agent in Cato Analytics that lets non-technical teams explore their data through conversation, with reliable tracing, exports, and access guardrails.
Internal product · the real interface with invented data
Tools used for this project
- BigQuery
- dbt
- SQL
- Figma
- Claude
- Langfuse



AI referrals have grown sharply this year — up from January ( sessions) to September (). October () is only a partial month.
1 query · 10 rows · 5 passes · Data from Jan 2026 to Oct 2026
compute · pct_change(src_1·r9, src_1·r1) = 0.646 → 65%
| Row | month | ai_sessions |
|---|---|---|
| r1 | 2026-01 | 17,753 |
| r2 | 2026-02 | 18,827 |
| r3 | 2026-03 | 20,343 |
| r4 | 2026-04 | 22,041 |
| r5 | 2026-05 | 23,126 |
| r6 | 2026-06 | 22,595 |
| r7 | 2026-07 | 24,262 |
| r8 | 2026-08 | 25,935 |
| r9 | 2026-09 | 29,227 |
| r10 | 2026-10 | 30,455 |
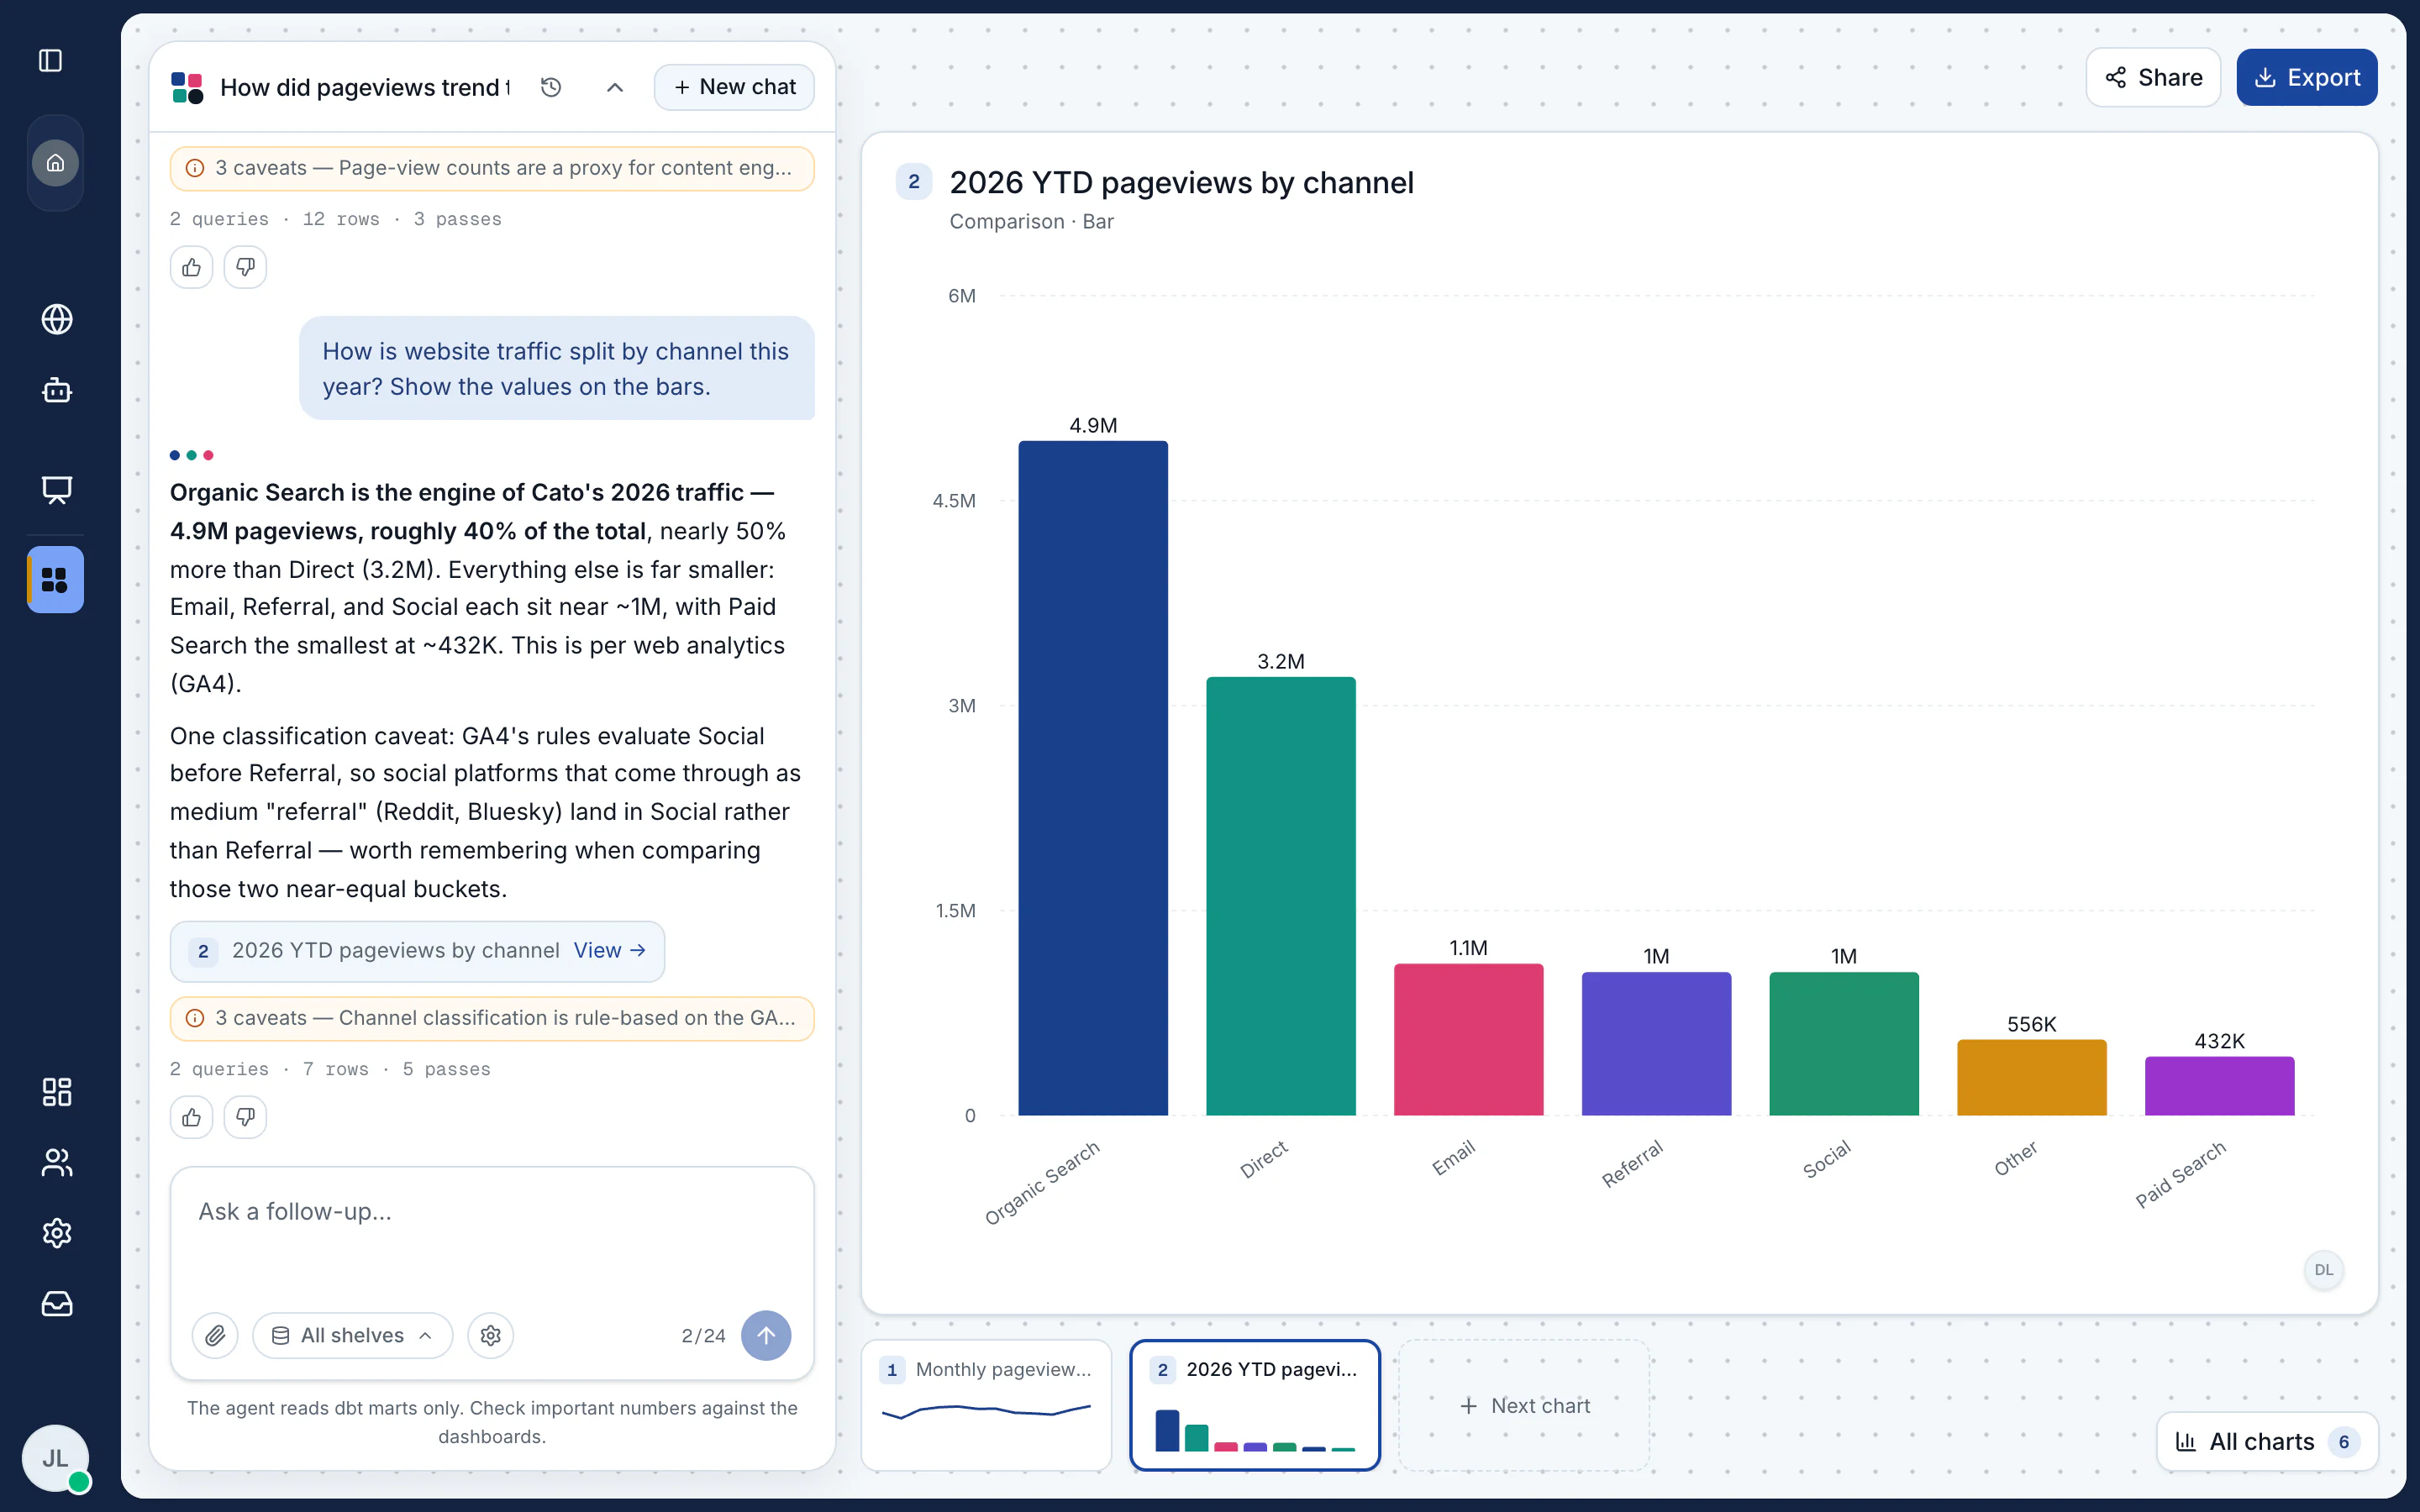
- A title for this answer
- The view it chose
- Values on the bars
- Caveats from the mart
- Queries · rows · passes
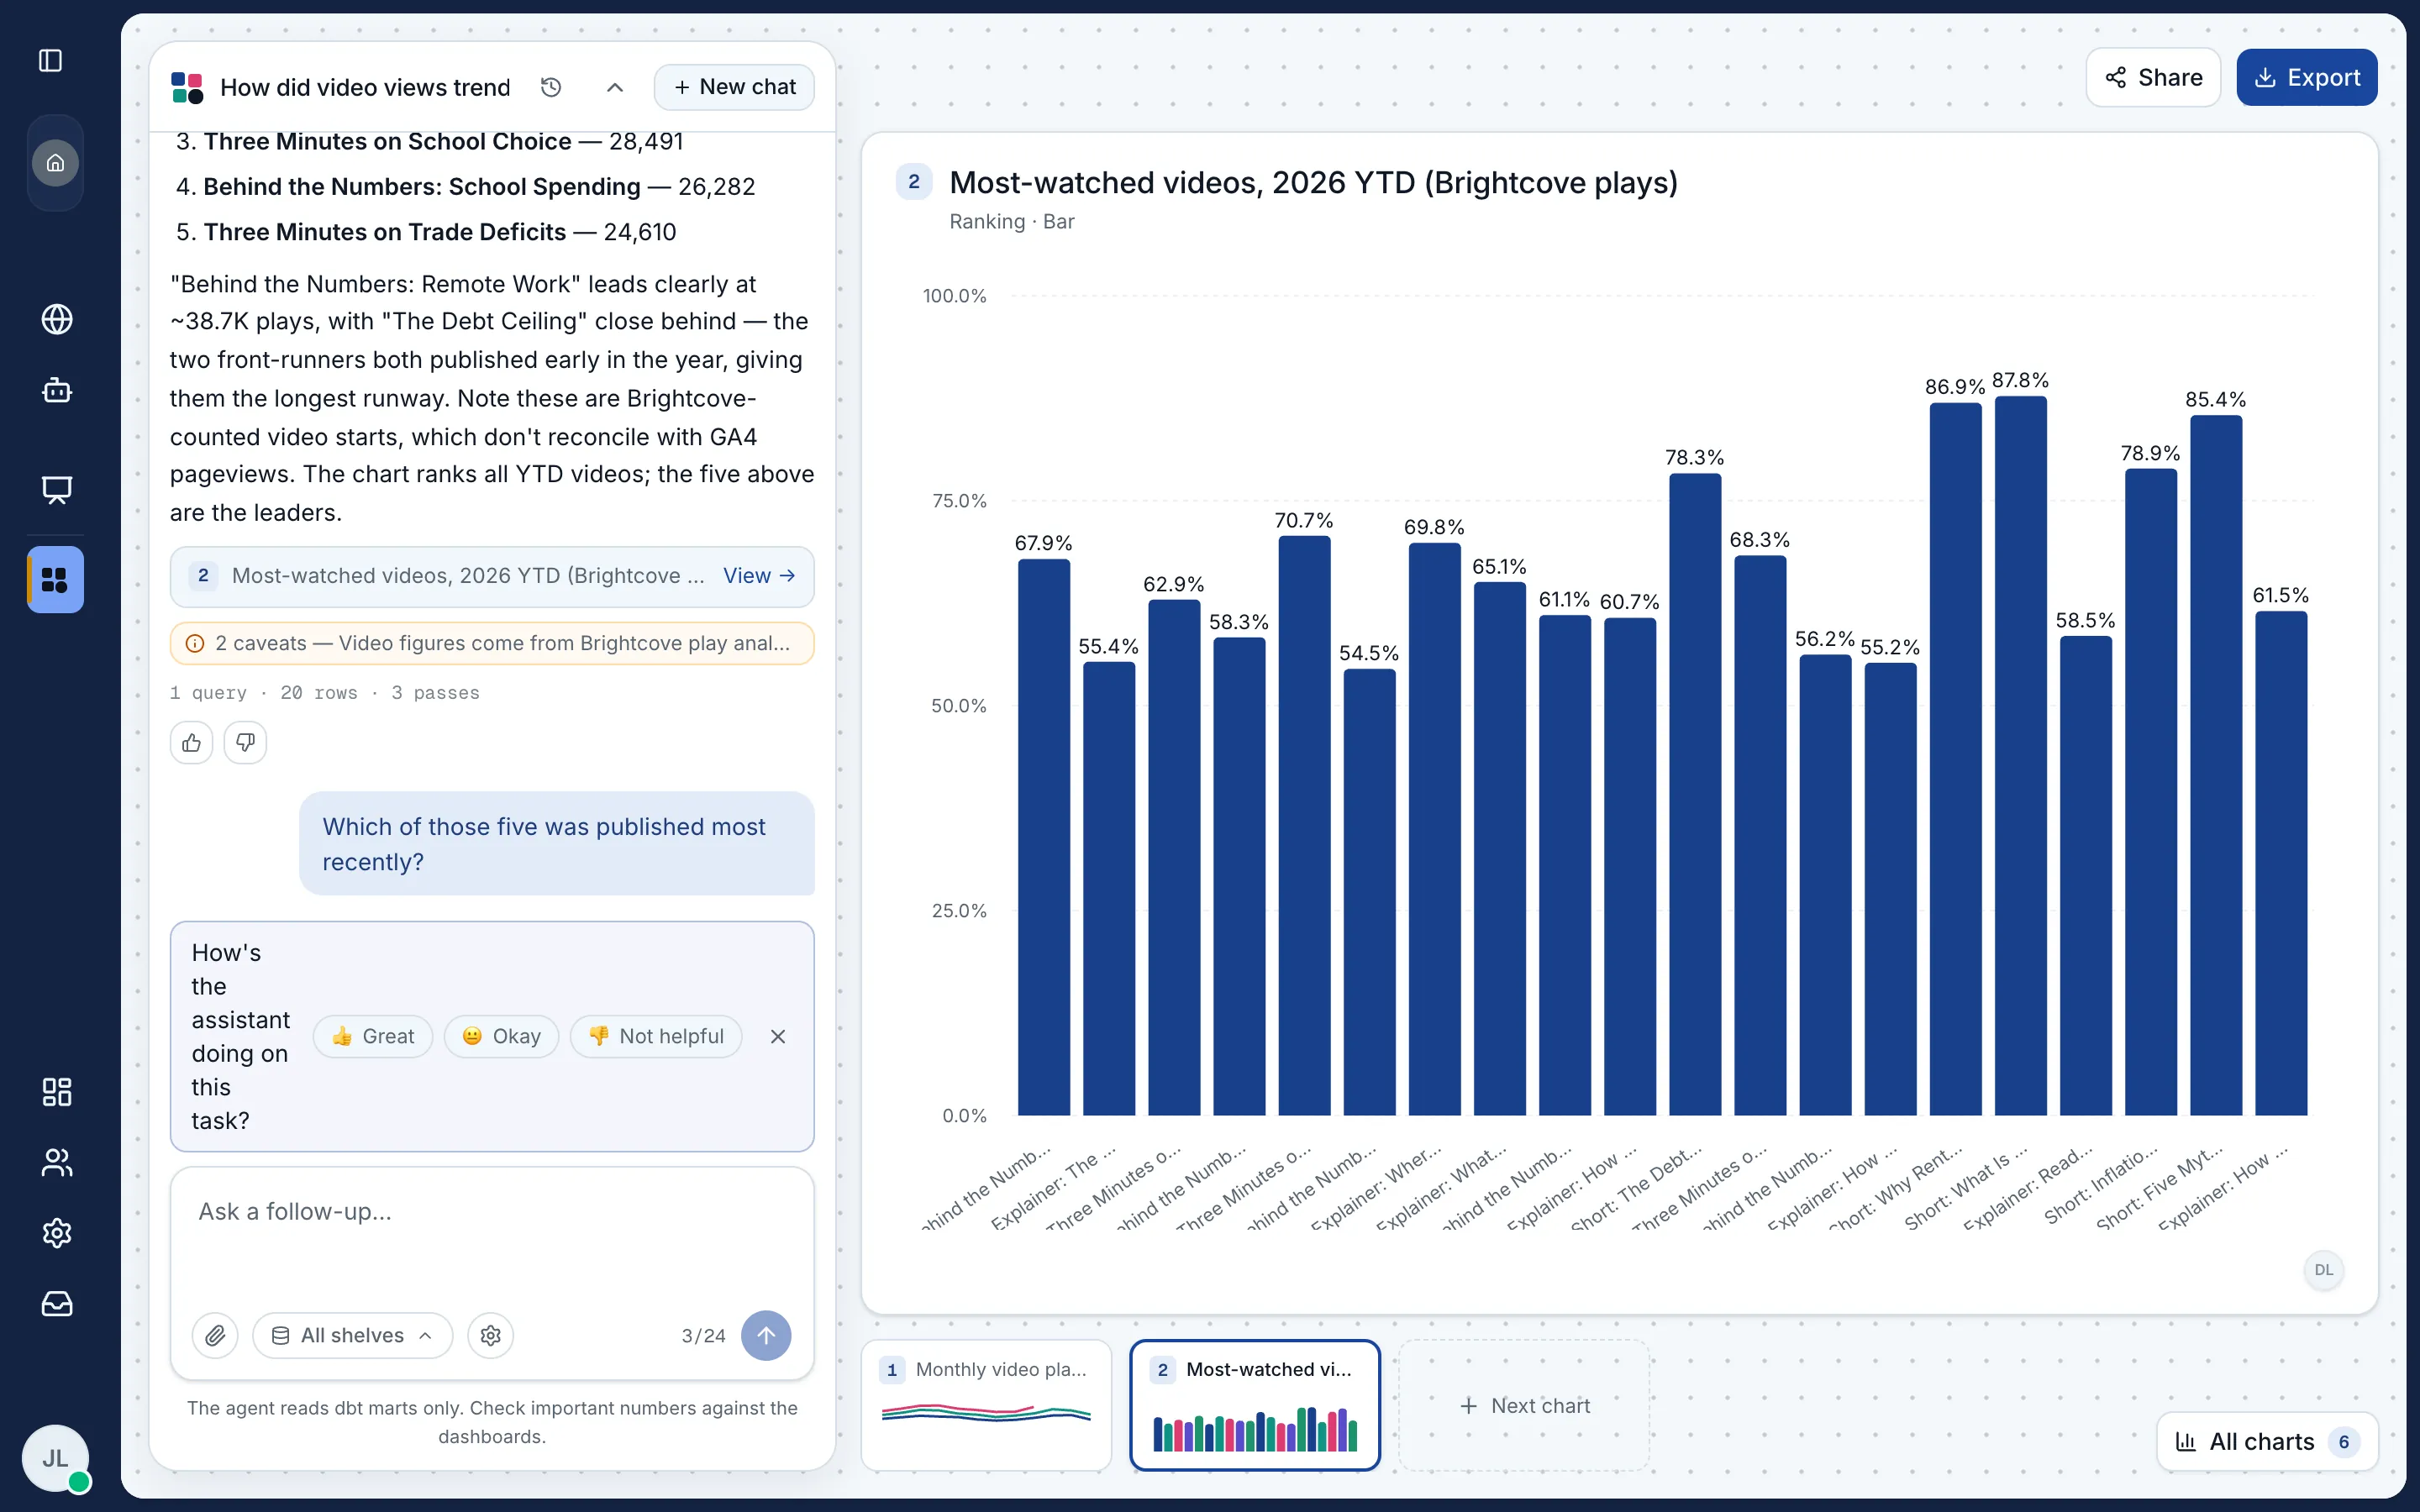
- Rate the answer
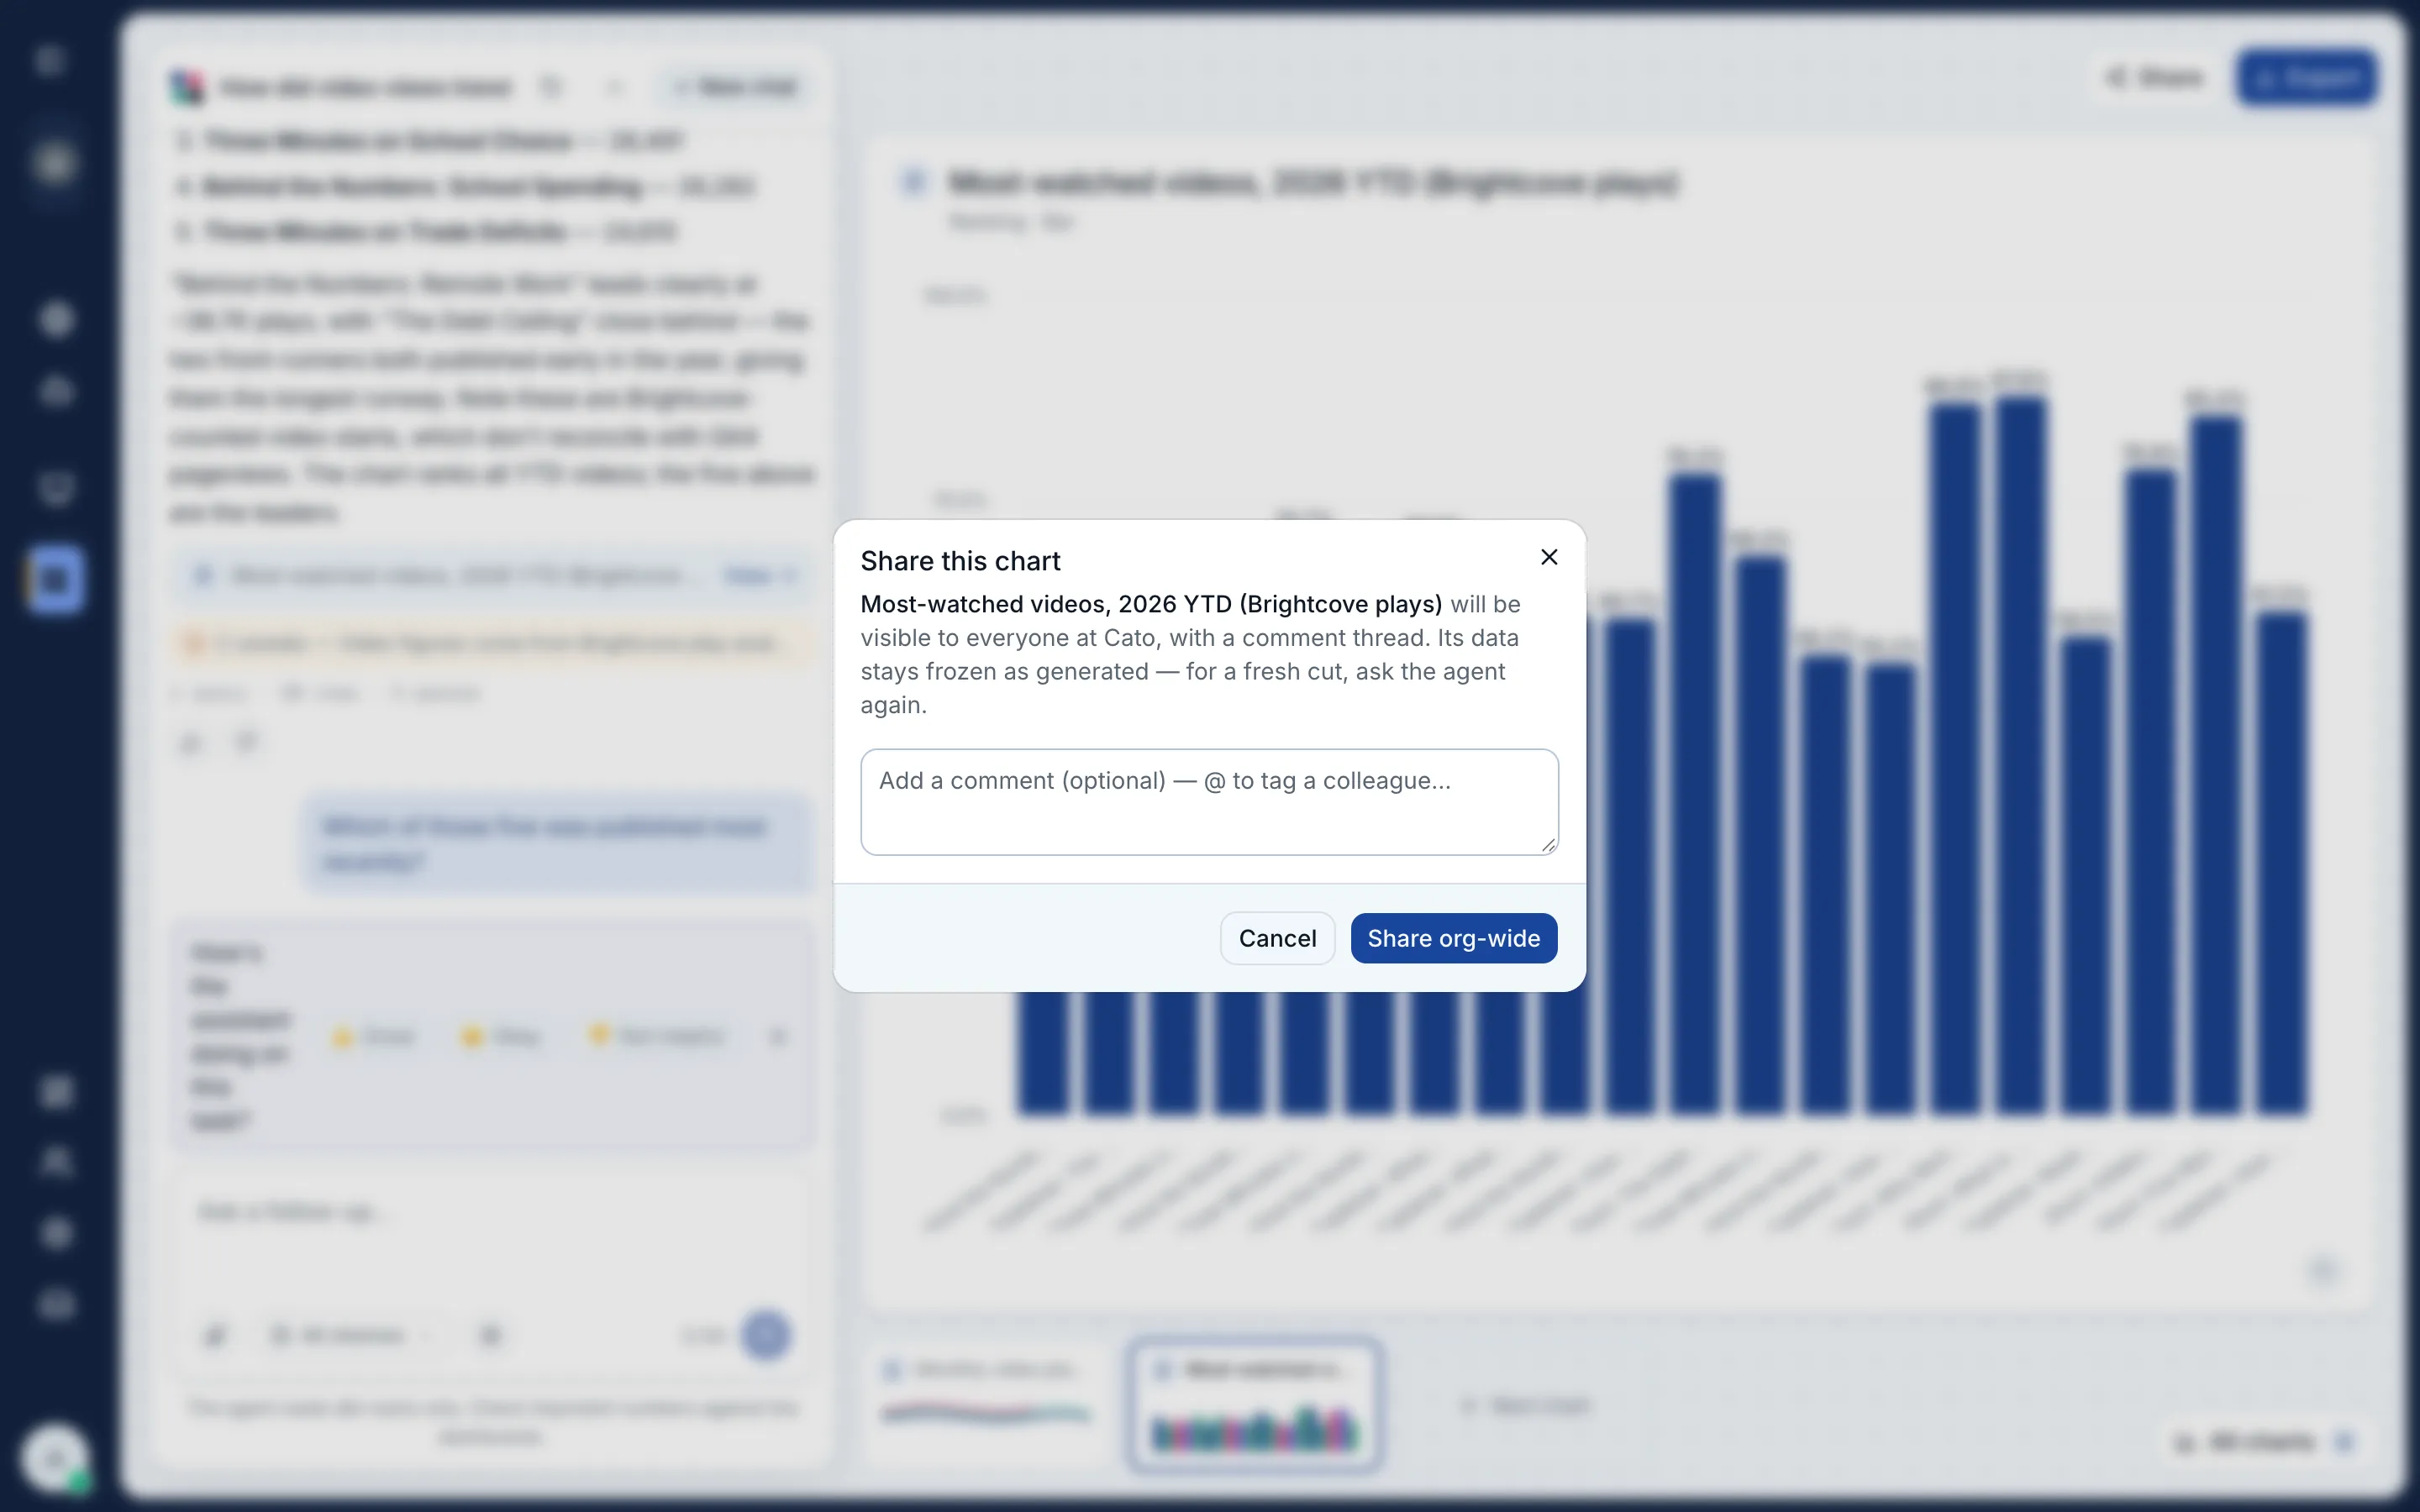
- Share with the org
- Export PNG or CSV
- The thread's filmstrip
- Every chart, kept


- Product · agentThe agent mark grows from the product mark
- RestA slow orbit on the welcome card
- ThinkingFolds into three dots
- WritingStream dots above the answer
- StagePixel grid and a timer

Every chart sparks a next question.
Every chart on the teams’ dashboard is focused on a key metric. The Data Lab agent’s access to both the data and its sources allows for additional and contextual exploration of the underlying nuances, which supports all users in dissecting and exploring the data in the directions led by their curiosity.
Clean tables before clever prompts. Structuring BigQuery and dbt for AI.
Raw tables invite broken joins and double-counted rows, so I modeled clean, pre-joined marts in the database with dbt. Each mart’s schema carries an agent block—grain, measures, caveats—that generates the catalog the agent reads. This approach allows every change in definition to reach the agent the same day, with no prompt to rewrite.
The AI translates; code calculates. Zero raw SQL and zero mental math.
The underlying language models are built to first clarify and decipher the user’s intent, so we can reliably turn the user’s prompt into a structured request against one mart; code validates it, runs the query, and computes every change (difference) by reference. An additional audit traces each provided figure the LLM shows to the user against the tool results obtained from the mart query.
AI referrals have grown sharply this year — up from January ( sessions) to September (). October () is only a partial month.
1 query · 10 rows · 5 passes · Data from Jan 2026 to Oct 2026
compute · pct_change(src_1·r9, src_1·r1) = 0.646 → 65%
| Row | month | ai_sessions |
|---|---|---|
| r1 | 2026-01 | 17,753 |
| r2 | 2026-02 | 18,827 |
| r3 | 2026-03 | 20,343 |
| r4 | 2026-04 | 22,041 |
| r5 | 2026-05 | 23,126 |
| r6 | 2026-06 | 22,595 |
| r7 | 2026-07 | 24,262 |
| r8 | 2026-08 | 25,935 |
| r9 | 2026-09 | 29,227 |
| r10 | 2026-10 | 30,455 |
- A title for this answer
- The view it chose
- Values on the bars
- Caveats from the mart
- Queries · rows · passes
- Rate the answer
- Share with the org
- Export PNG or CSV
- The thread's filmstrip
- Every chart, kept
A split canvas designed for charts.
Given that data exploration is a visual task, a split workspace provides an enhanced environment for users to visually engage with the chart while allowing room for threaded conversations in a single session.
What’s happening behind the scenes? Turning database wait time into trust.
Unmasking the system’s actions and real-time statuses keeps the users informed about the agent’s actions. This encourages a little more patience and grace from users when database pulls, calculations, and chart visualizations need a little more time. Using the brand colors, I designed animated agent marks that connect with live step readouts to encourage retention.
- Product · agentThe agent mark grows from the product mark
- RestA slow orbit on the welcome card
- ThinkingFolds into three dots
- WritingStream dots above the answer
- StagePixel grid and a timer
Guided conversations, guarded on access.
Data source pins and filters offer underlying context for agents when selected by the user. This allows faster, more nuanced analysis over longer threaded conversations. Filter and catalog implementations were scoped with data access in mind, which prevents users from choosing data not granted to them, allowing the agent to gracefully decline when prompted.
Data transparency, enhanced collaboration, and weekly evals.
Anyone can download the rows behind a chart as a CSV, or share a snapshot across the organization with a comment thread. Simple user feedback mechanisms like thumbs up/down provide quick opportunities for user feedback without interruption and allow the agent to document user-scoped preferences on chart types, while also serving as a key user feedback system for feature ideas and bug resolutions.
Reflection
My most important takeaway is that the performance and efficiency of LLMs in applied data projects are influenced more by the design of the underlying database and its pipelines. Cleaner, more structured data tables and dbt models facilitated higher output quality than the choice of models used. Also, my prior ownership and understanding of the database, its design, and ELT processes facilitated quicker diagnosis and agent error detection as an added advantage.
Questions about this project?
Get in touch